
4
📌 IPO Snapshot
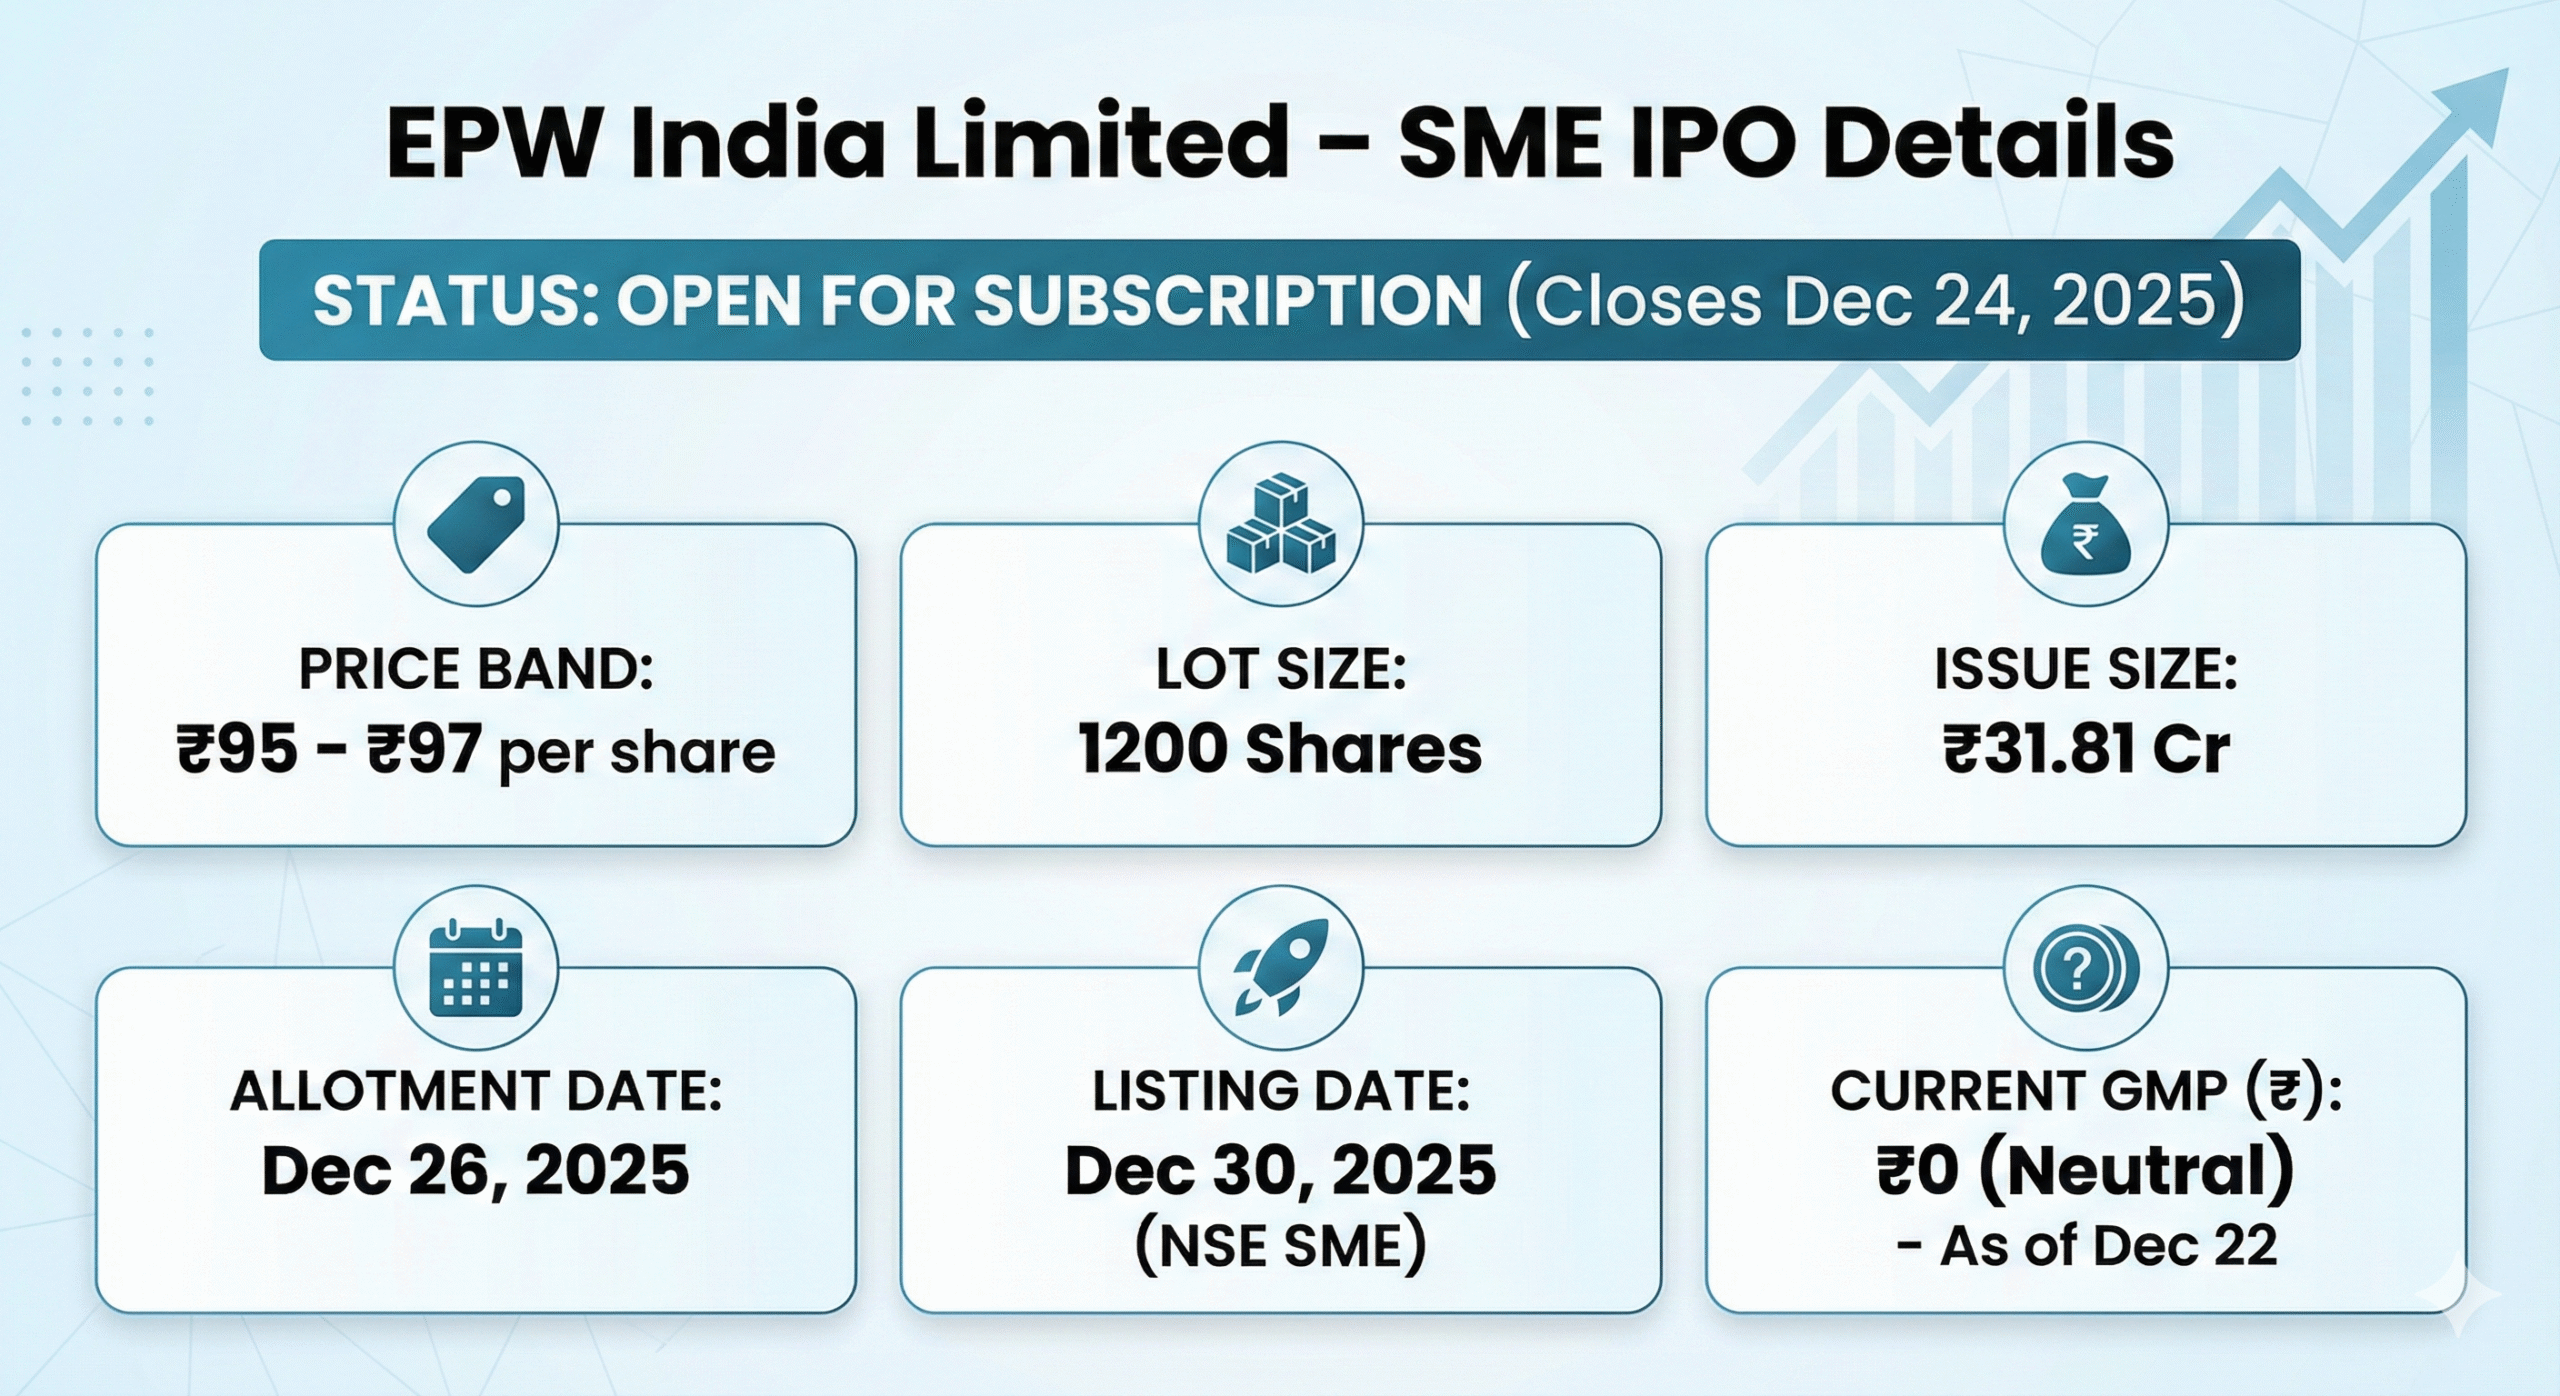
- Company Name: EPW India Limited
- IPO Category: SME Book Built Issue
- Listing Exchange: NSE SME (Emerge)
- Issue Size: Around ₹31.8 crore
- Issue Type: Fully Fresh Issue
- Face Value: ₹5 per equity share
💰 Price & Lot Information
- Price Band: ₹95 – ₹97 per share
- Lot Size: 1,200 shares
- Minimum Investment: Approx. ₹1.16 lakh (at upper price band)
📅 Key Dates (Tentative)
- IPO Opens: 22 December 2025
- IPO Closes: 24 December 2025
- Allotment Finalisation: 26 December 2025
- Refunds Initiated: 29 December 2025
- Shares Credited to Demat: 29 December 2025
- Listing Date: 30 December 2025
🏢 Company Overview
EPW India Limited operates in the IT asset refurbishment and resale space. The company focuses on sourcing used electronic equipment, performing secure data wiping, refurbishing hardware, and reselling upgraded devices such as laptops, desktops, and accessories through multiple sales channels.
🎯 Objects of the Issue
IPO proceeds will be utilised for:
- Funding working capital needs
- Reducing existing borrowings
- Supporting day-to-day business expansion
- General corporate purposes

📊 Investment Perspective
Being an SME IPO, EPW India may suit investors who understand higher risk, lower liquidity, and higher volatility compared to mainboard listings.
| Financial Year | Revenue (₹ crore) | Profit After Tax (₹ crore) |
|---|---|---|
| FY23 (Mar 31, 2023) | ~6.66 | ~0.06 |
| FY24 (Mar 31, 2024) | ~18.53 | ~0.74 |
| FY25 (Mar 31, 2025) | ~53.34 | ~4.33 |
| Shows strong year-on-year revenue and profit growth. (Groww) |
Expense & Profitability Trends
- Operating Income (FY25): ₹51.88 crore
- Operating Profit (FY25): ₹5.75 crore
- Adjusted PAT (FY25): ₹4.04 crore
(These figures reflect operating strength after normal business costs.) Goodreturns
Growth Highlights
- Revenue climbed by ~188% from FY24 to FY25.
- PAT increased by ~485% over the same period.
(These indicate strong growth ahead of the IPO.) Univest
Balance Sheet Indicators
| Category | FY25 | FY24 |
|---|---|---|
| Total Assets (₹ crore) | ~26.55 | ~8.10 |
| Net Worth (₹ crore) | ~5.28 | ~0.85 |
| Total Borrowings (₹ crore) | ~12.25 | ~0.23 |
Balance sheet shows growing scale and increasing leverage. Univest
📌 What This Means
- Strong Top-Line Momentum: The company has scaled revenue from modest levels in earlier years to ₹50+ crore in FY25. Groww
- Profitability Improved Sharply: Profit levels increased significantly, reflecting operational improvements ahead of public listing. Groww
- Rapid Expansion: Both assets and net worth have grown materially, indicating business expansion and reinvestment. Univest
- Higher Borrowings: Total borrowings increased, which may reflect funding for growth or working-capital needs. Univest